
The EU 50 has entered 2026 with powerful upside momentum, capturing global investor attention as European equities regain leadership. After closing 2025 with double-digit gains, the EU 50 continues to trade near record territory, supported by resilient macro data, accommodative monetary policy, and improving earnings visibility.
As a benchmark index tracking 50 leading Eurozone blue-chip companies, the EU 50 reflects the strength of Europe’s most influential sectors—financials, industrials, technology, and utilities. With structural and cyclical drivers aligning, the near-term trajectory of the EU 50 appears constructive, suggesting further gains could unfold through the first half of 2026.
Below, we examine the macro backdrop, sector leadership, capital flows, valuation trends, and technical structure shaping the next phase of the EU 50 rally.
Monetary Stability Creates a Supportive Environment for EU 50
One of the key foundations behind the EU 50 advance has been policy stability from the European Central Bank. Through late 2025 and into early 2026, rates have remained steady, reinforcing a predictable liquidity environment for equity markets.
Lower volatility in monetary policy tends to compress risk premiums. For the EU 50, this translates into:
- Reduced financing pressure on corporates
- Improved capital allocation visibility
- Sustained equity inflows
Inflation trends have gradually moderated toward the 2% region, easing cost burdens for both consumers and enterprises. With inflation stabilizing and growth expectations improving modestly, the EU 50 benefits from a rare alignment of price stability and expansionary potential.
Markets currently price limited tightening risk over the next quarter. This stability keeps the risk-reward profile of the EU 50 attractive relative to other developed markets facing policy uncertainty.
Fiscal Impulse and Structural Investment Boost the EU 50
Beyond monetary conditions, fiscal expansion plays a crucial role in reinforcing EU 50 strength.
Germany’s infrastructure and defense initiatives, alongside broader EU recovery funding, inject direct stimulus into cyclical sectors. Industrial production indicators have started to rebound, and capital expenditure plans remain constructive.
For the EU 50, this fiscal momentum benefits:
- Industrial conglomerates
- Engineering and construction firms
- Capital goods manufacturers
- Financial institutions supporting project lending
Rather than relying purely on liquidity-driven valuation expansion, the EU 50 now rests on tangible earnings drivers supported by fiscal spending.
This shift from austerity toward strategic investment represents a structural change in the European growth narrative—one that markets are increasingly recognizing.
Economic Resilience Strengthens the EU 50 Earnings Outlook
Recent quarterly data showed moderate GDP expansion across the Eurozone. While growth remains measured, forward indicators such as PMIs suggest stabilization in manufacturing activity.
Corporate earnings expectations for EU 50 constituents point toward double-digit expansion in 2026. If realized, that growth profile would justify continued price appreciation.
Key drivers include:
- Stronger bank net interest margins
- Reacceleration in industrial demand
- Increased electrification and infrastructure investment
- Stabilizing consumer confidence
The EU 50 is particularly sensitive to cyclical recovery due to its sector composition. As macro headwinds fade, earnings momentum could accelerate further.
Banking Sector Leadership Within the EU 50
Banks have emerged as one of the strongest-performing segments within the EU 50.
Capital ratios remain healthy, profitability metrics have improved, and valuations still trade below long-term historical averages. If credit demand continues to recover modestly, the EU 50’s financial weight could provide additional upside leverage.
Utilities and Infrastructure Themes
Utilities within the EU 50 are benefiting from electrification, renewable energy expansion, and data center demand. Investment pipelines remain robust, with multi-year capital spending plans supporting revenue visibility.
The structural nature of these themes reinforces medium-term confidence in the EU 50.
Global Capital Rotation Supports EU 50 Valuation Expansion
Another important dynamic shaping the EU 50 outlook is global asset allocation rotation.
For years, European equities traded at a valuation discount relative to U.S. markets. However, stretched multiples in U.S. mega-cap technology have prompted diversification flows.
Investors are increasingly:
- Reducing concentration risk
- Seeking value-oriented exposure
- Diversifying geographically
The EU 50 stands out as a liquid, diversified vehicle for accessing European blue chips. As capital rotates internationally, valuation gaps narrow—benefiting the EU 50 disproportionately.
Valuation Perspective: Is the EU 50 Still Attractive?
Despite its rally, the EU 50 remains reasonably valued relative to long-term averages. Earnings growth projections for 2026 provide a cushion against multiple compression risk.
Key considerations:
- Forward P/E ratios remain moderate
- Dividend yields are competitive
- Balance sheets are generally stable
Compared to peers, the EU 50 offers a balanced combination of income and growth exposure.
This valuation support suggests that pullbacks may attract buyers rather than trigger prolonged corrections.
Technical Structure: Momentum Favors Continuation
From a technical standpoint, the EU 50 maintains a clear bullish structure.
Since breaking out of its consolidation phase in late 2025, the EU 50 has formed a sequence of higher highs and higher lows—an essential hallmark of trend strength.
Momentum indicators show elevated readings, but no confirmed reversal signals are present.
Key Levels to Monitor
- 6080: Breakout continuation level
- 5950: Support and potential re-entry zone
- Psychological milestone above recent highs
As long as the EU 50 holds above structural support zones, trend-following strategies remain favored.
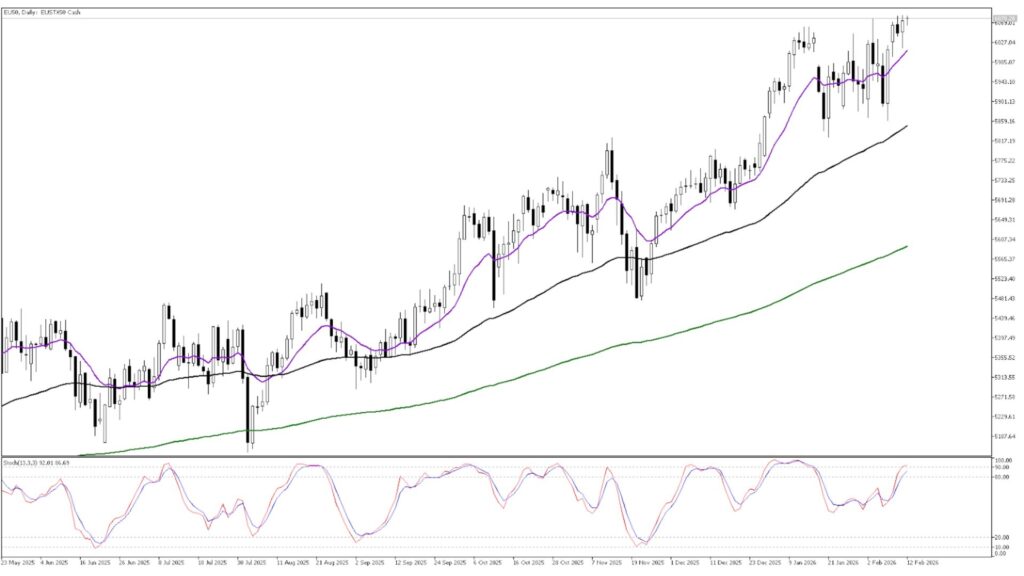
▲EU50 Daily Chart
Risk Factors That Could Impact the EU 50
No bullish outlook is complete without considering downside risks.
Potential headwinds include:
- Unexpected inflation resurgence
- Policy tightening surprises
- Geopolitical tensions
- External demand shocks
However, the diversified composition of the EU 50 helps cushion sector-specific disruptions.
Investors should remain data-driven rather than sentiment-driven when evaluating risk exposure.
Strategic Positioning: How Investors Approach the EU 50
There are multiple ways market participants can approach EU 50 exposure:
- Trend-following during breakouts
- Buying pullbacks near structural support
- Dividend-focused longer-term allocation
- Sector rotation within EU 50 components
Education remains critical for effective execution. Investors who want to deepen their understanding of macro-driven index trading can learn more through structured market insights.
Access to reliable brokerage infrastructure also matters. Platforms such as Ultima Markets provide tools for tracking EU 50 price action and risk metrics efficiently.
Conclusion
The EU 50 enters mid-2026 supported by multiple reinforcing drivers:
- Monetary stability
- Fiscal expansion
- Earnings growth acceleration
- Global capital rotation
- Constructive technical structure
Rather than being purely speculative, the EU 50 advance reflects improving macro conditions and credible corporate profitability expansion.
While short-term volatility is always possible, the broader structure suggests dips may present opportunity rather than danger. If current trends persist, the EU 50 could challenge fresh highs as the year progresses.
FAQ
What is the EU 50 index?
The EU 50 tracks 50 leading blue-chip companies across the Eurozone, representing major sectors such as financials, industrials, and utilities.
Why is the EU 50 rising in 2026?
The EU 50 benefits from stable monetary policy, fiscal stimulus, earnings growth expectations, and global capital rotation toward European equities.
Is the EU 50 overvalued?
Despite recent gains, the EU 50 remains reasonably valued compared to historical averages and international peers, supported by projected earnings growth.
What technical levels are important for the EU 50?
Key levels include 6080 as a breakout threshold and 5950 as a support area for potential pullback entries.
How can traders gain exposure to the EU 50?
Traders can use index CFDs via regulated platforms, starting with a demo environment before transitioning to live execution.
This article represents the author’s personal views only and is for reference purposes. It does not constitute any professional advice.